The Sentinel Network Problem
Written by
Valentine Godin

What sixty years of the same form makes possible
In the winter of 2008, around a hundred general practices across England were doing what they do every week: filing a short standardised report to Public Health England. The report asks one thing: how many patients presented this week with a new episode of acute illness, temperature above 38 degrees, and at least one respiratory symptom? Not "how many people seemed unwell." A defined case. A consistent threshold. The same form, every practice, every week, since 1967.
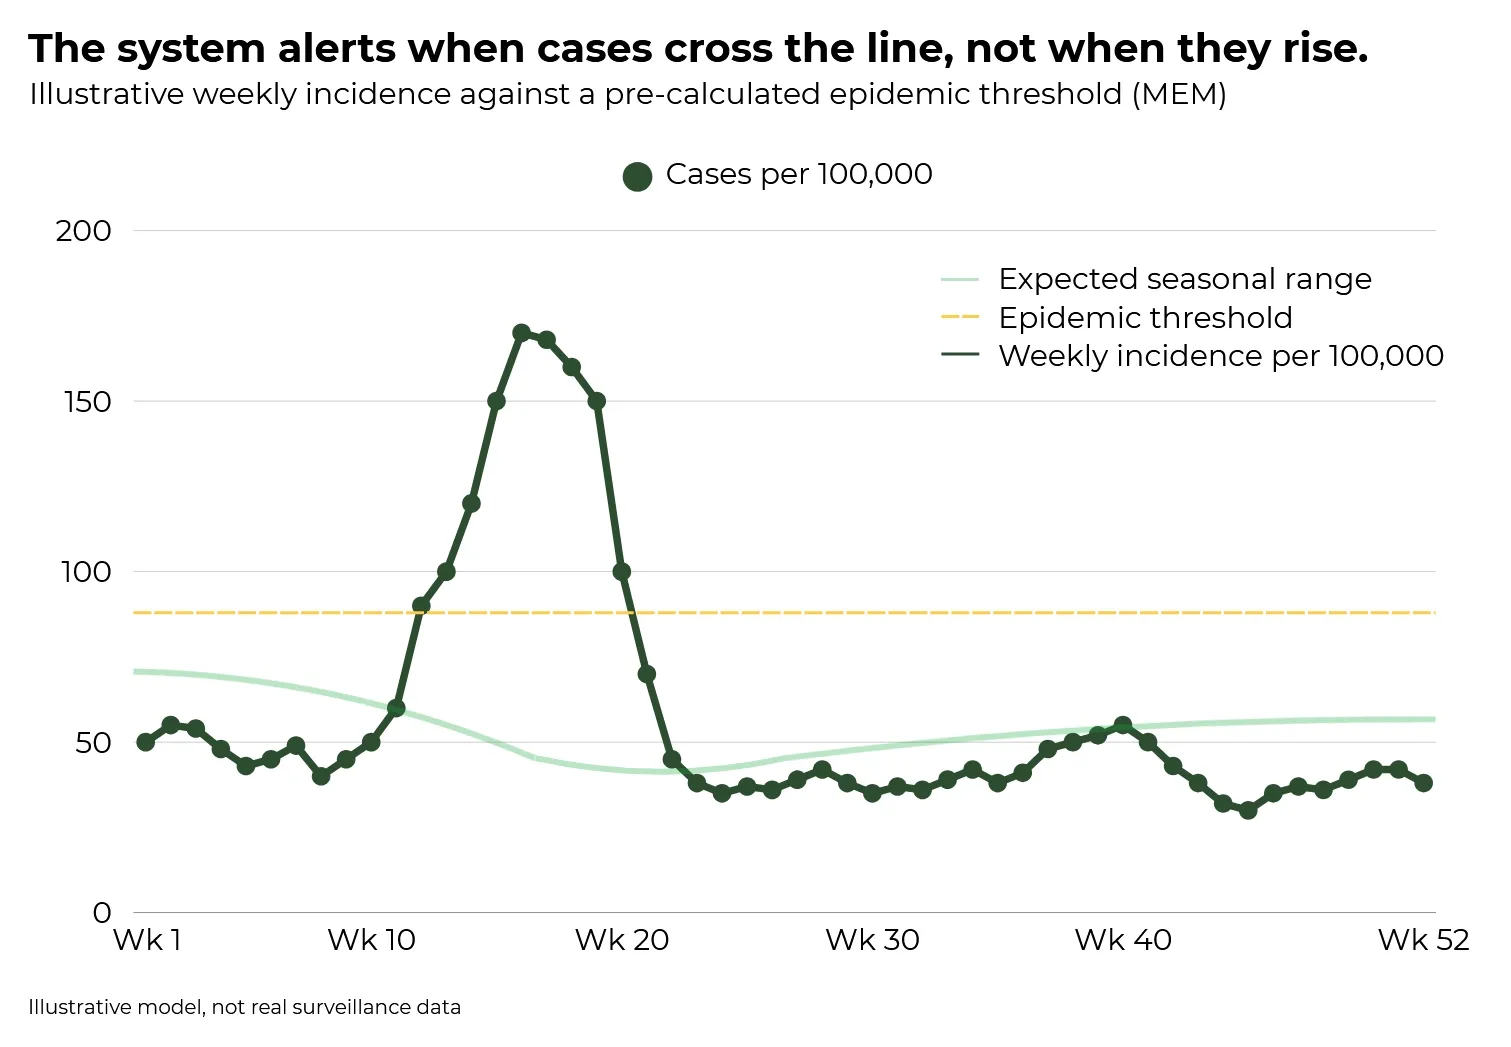
In April 2009, the weekly returns from those practices crossed a threshold. The incidence rate had exceeded the pre-calculated epidemic baseline in an unusual demographic cohort, in a pattern that did not match the seasonal norm. Laboratory confirmation had not arrived. No clinical announcement had been made. The system had already registered that something had changed.
Early detection was a function of continuity, not capability: the same form, filed every week for forty-two years.
What makes a sentinel network work
The RCGP/UKHSA influenza sentinel system is not a technology story. The practices use ordinary clinical record systems. The weekly report is a spreadsheet return. The signal emerges not from sophisticated infrastructure but from two principles working together.
First: every observer uses the same case definition. "ILI confirmed present" means the same thing in Exeter as it does in Newcastle. Second: the data is expressed as an incidence rate per 100,000 population rather than raw counts, which makes regions of different sizes directly comparable. A rural practice and an urban one contribute equivalent observations.
From that comparable dataset, the system calculates a statistical baseline using the Moving Epidemic Method (MEM), developed by Tomás Vega and colleagues and now used across ECDC's thirty-country surveillance network. The MEM defines not just an average but a threshold: the point at which weekly incidence has moved from normal seasonal variation into epidemic activity. The system does not alert when cases go up. It alerts when cases cross the pre-calculated line.
This is the critical distinction. The sentinel network does not standardise treatment. How each GP manages an individual patient varies enormously. What it standardises is the observation: what counts as a case, what the threshold is, what conditions accompany it. Then it applies a statistical framework that defines what counts as signal against expected background noise.
The ECDC took the same principle to continental scale. TESSY, The European Surveillance System, has been collecting standardised surveillance data on 52 communicable diseases across 30 countries since 2008. What makes it work is not the technology, it is that every country files the same observation in the same format, and the intelligence that emerges is simply not available any other way.
The turf gap
Every greenkeeper has a spray diary. Many are now digital. Across facilities, those records are rarely structured in a way that makes them comparable with anyone else's.
"Dollar spot present" on one course's records means the superintendent identified the first cottony mycelium on the leaf surface at 6am — before the dew dried, before any patch had formed. On another, the same words describe established straw-coloured patches across multiple greens, visible and measurable by area. The first record is an early warning. The second is a progress report. Both describe the same pathogen actively present on the course. The observations may be three to five days apart in the disease's development, and there is no shared severity scale connecting them.
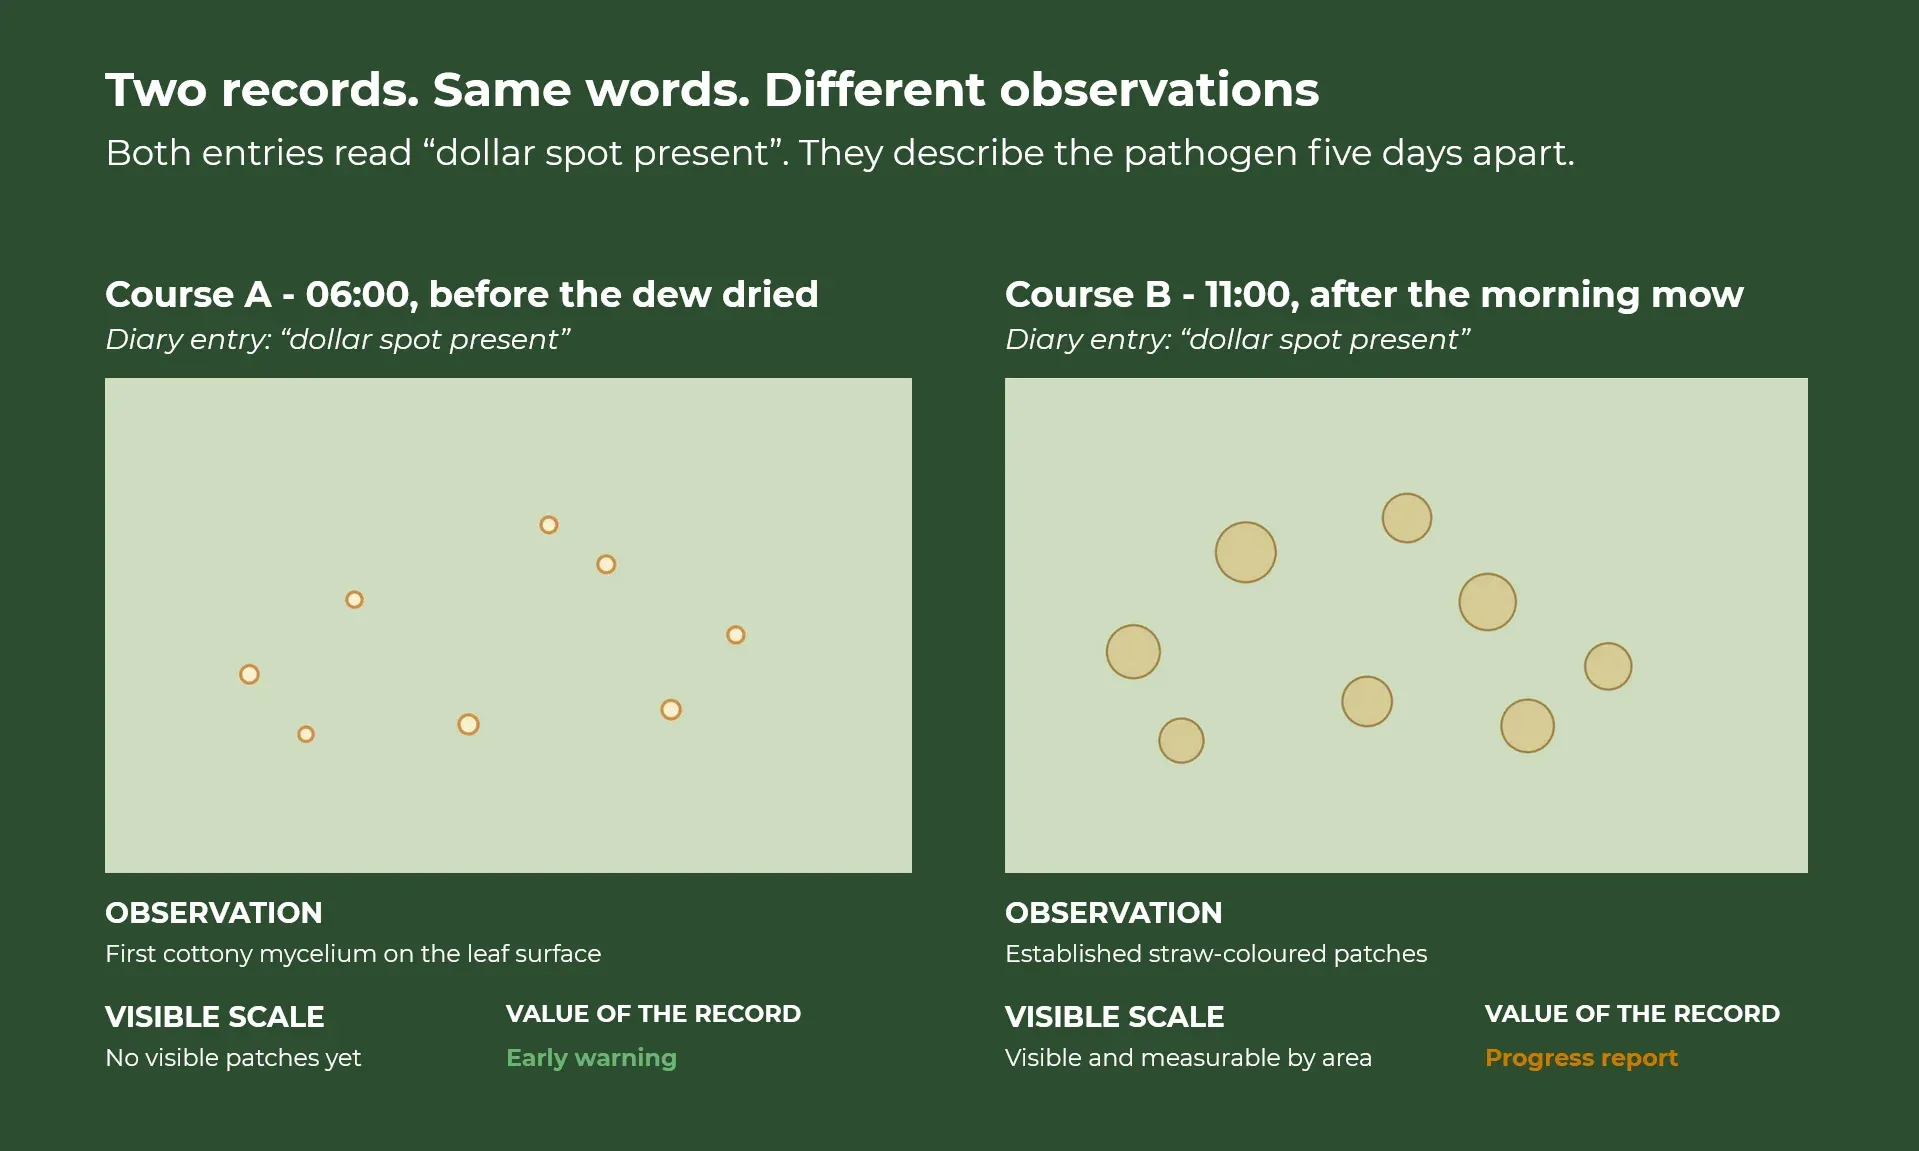
This is not a data problem in the conventional sense. The data exists. The observations happen. The management decisions are made and recorded. It is a structural problem: the records of those observations have never been required to connect to each other, not across facilities, and more importantly, not within a single facility across seasons.
Plant pathology research has had standardised disease assessment protocols for decades: the Horsfall-Barratt scale, percent area affected per defined assessment unit, structured severity ratings. These are used in trial work. The disconnect is that they have not migrated from research conditions into routine field practice, consistently, at scale.
The result is an intelligence gap that is quite specific. A superintendent treating dollar spot, on a Surrey bentgrass course in three consecutive Junes holds data that is potentially more valuable than any generic risk model. But unless those application records are linked to the conditions that preceded treatment (the accumulated risk index at the time, leaf wetness hours, overnight temperatures, the nitrogen programme over the preceding weeks), the pattern cannot be extracted. The data exists. The structure that would make it exploitable does not.
The individual data stack is already a predictive system
The Smith-Kerns Dollar Spot Prediction Model, developed at North Carolina State University and published in Plant Disease in 2018, generates a risk index from a 5-day rolling mean of daily maximum temperature, minimum temperature, and relative humidity. It is the most rigorously validated predictive model available for the pathogen and it works, but it works as a population-level instrument. It predicts conducive conditions, not infection events. It does not know your cultivar's susceptibility, your soil's nitrogen dynamics, your thatch depth, or the management history that has shaped your site's specific response to those conditions.
The gap between "conditions are conducive" and "disease will appear on your greens" is precisely the gap that site-specific structured data closes.
When spray applications are linked in a structured system to the conditions at time of treatment (the risk index value, leaf wetness hours, soil temperature, nitrogen inputs, mowing height, and any recent mechanical operations that may have stressed the sward) and to the observed outcomes that followed, you can ask a question no generic model can answer: what combination of conditions has, on this specific site, reliably preceded a disease event over the past three seasons?
The answer to that question, drawn from a facility's own structured records, is already a site-specific predictive model — one that no external tool can replicate, because it was built from the specific ground it is being asked about.
And it extends. When the same structured data links nutrition inputs to growth response, soil condition to infiltration rate, management decision to measurable outcome across a full season, the facility has built something more useful than any external model calibrated to a distant population of courses: an increasingly precise record of cause and effect on their own ground.
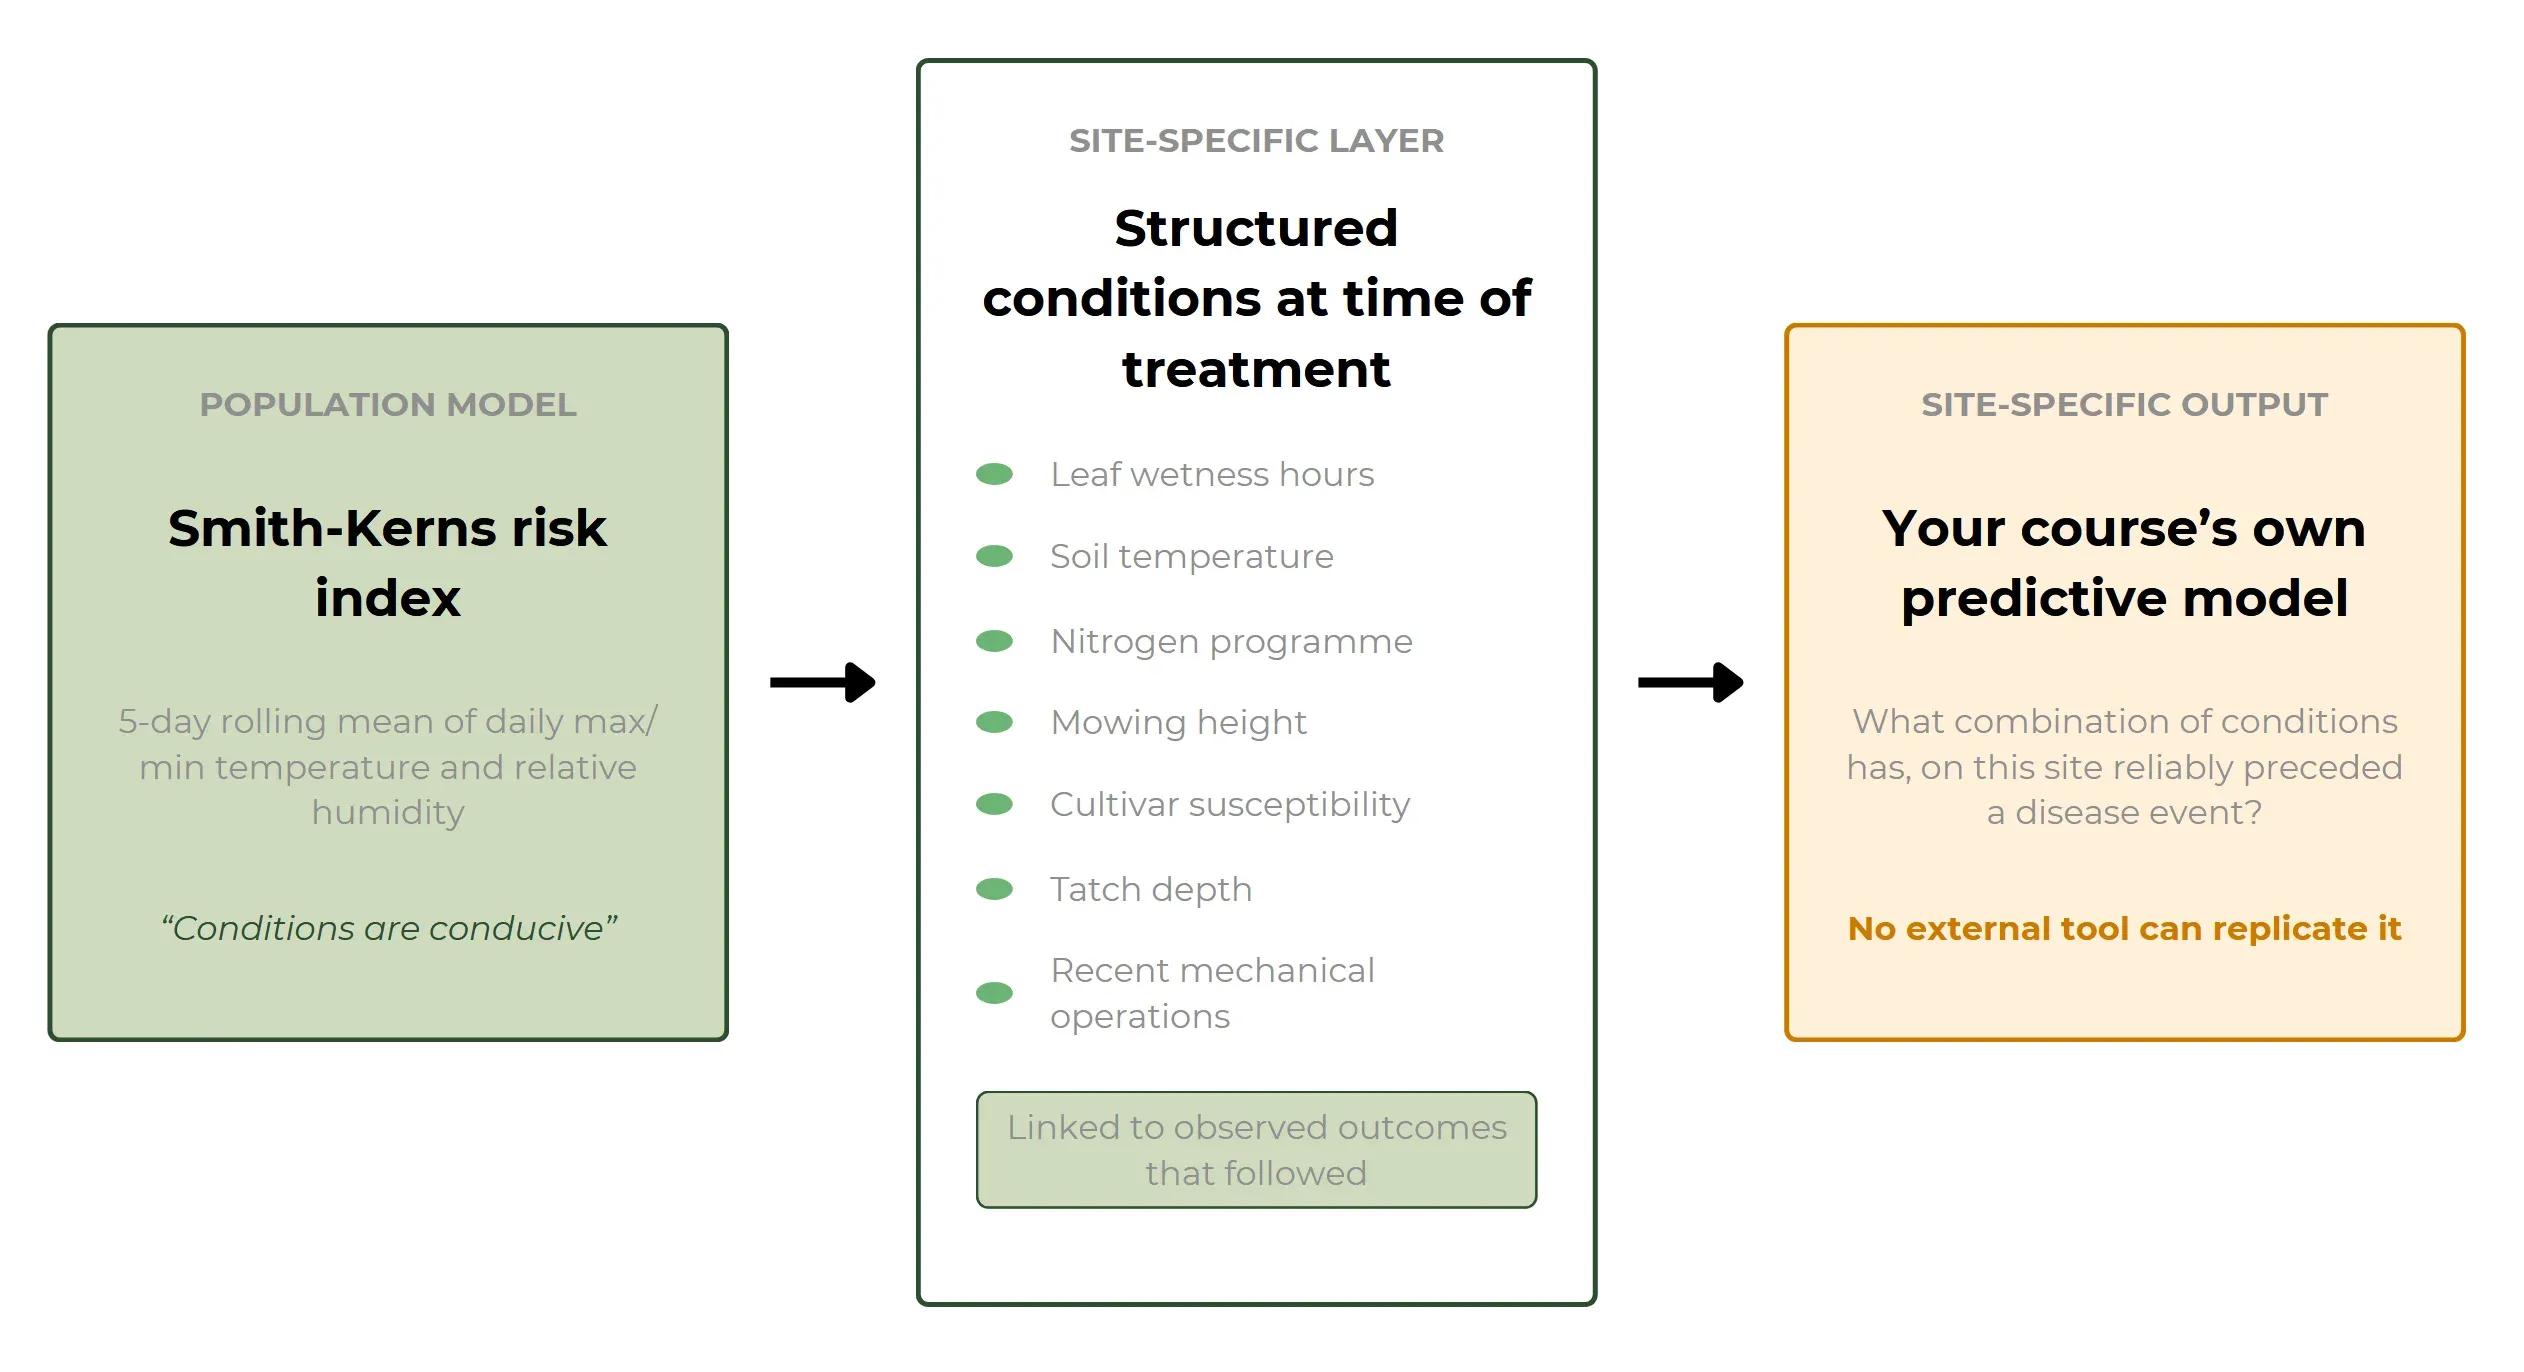
This is the individual data stack that matters. It does not require a new reporting initiative. It requires that the data collected in the normal course of management, which already exists, be structured in a way that makes it linkable, queryable, and comparable across time.
The thing that was actually invented in 1967
Infectious disease practitioners had been watching patterns for centuries before the sentinel GP network existed. John Snow mapped the Broad Street cholera outbreak in London in 1854. William Farr was publishing statistical analyses of mortality by cause at the General Register Office from 1839. The observation was not new.
What changed in 1967 was not the observation. It was the standardisation of what counted as an observation, and the architecture that made individual observations comparable at a regional scale.
That is a different technology from the data tools that followed. It is also, by a significant margin, the more consequential one. Without the shared definition, no amount of data infrastructure produces intelligence. With it, individual practices doing their ordinary work contribute, without extra effort, to a system that can detect what no single practitioner could see alone.
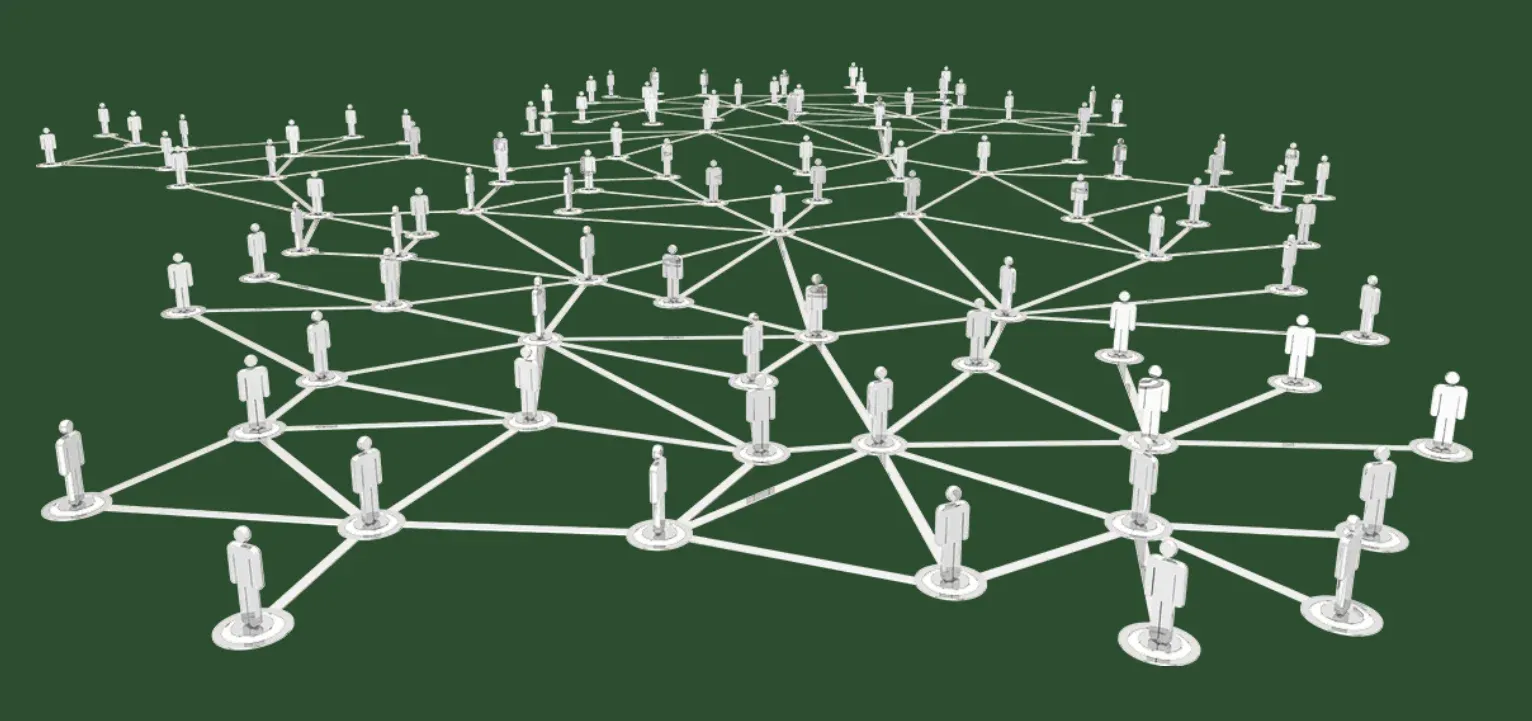
The turf industry is, in 2026, in the position of having the practitioners, the data, and increasingly the digital infrastructure. The sentinel network does not need to be built separately. It needs to emerge from the data architecture that good individual facility management already justifies, applied consistently, connected at scale.
Sources: Smith-Kerns Dollar Spot Prediction Model — Smith et al., Plant Disease, 2018. Moving Epidemic Method — Vega et al., Influenza and Other Respiratory Viruses, 2013. Clarireedia jacksonii taxonomic reclassification, 2018. ECDC TESSY — ecdc.europa.eu/en/tessy. RCGP/UKHSA sentinel surveillance — ukhsa.gov.uk. USGA Green Section turfgrass disease research — usga.org/course-care
Topics
Latest Articles
Back to all posts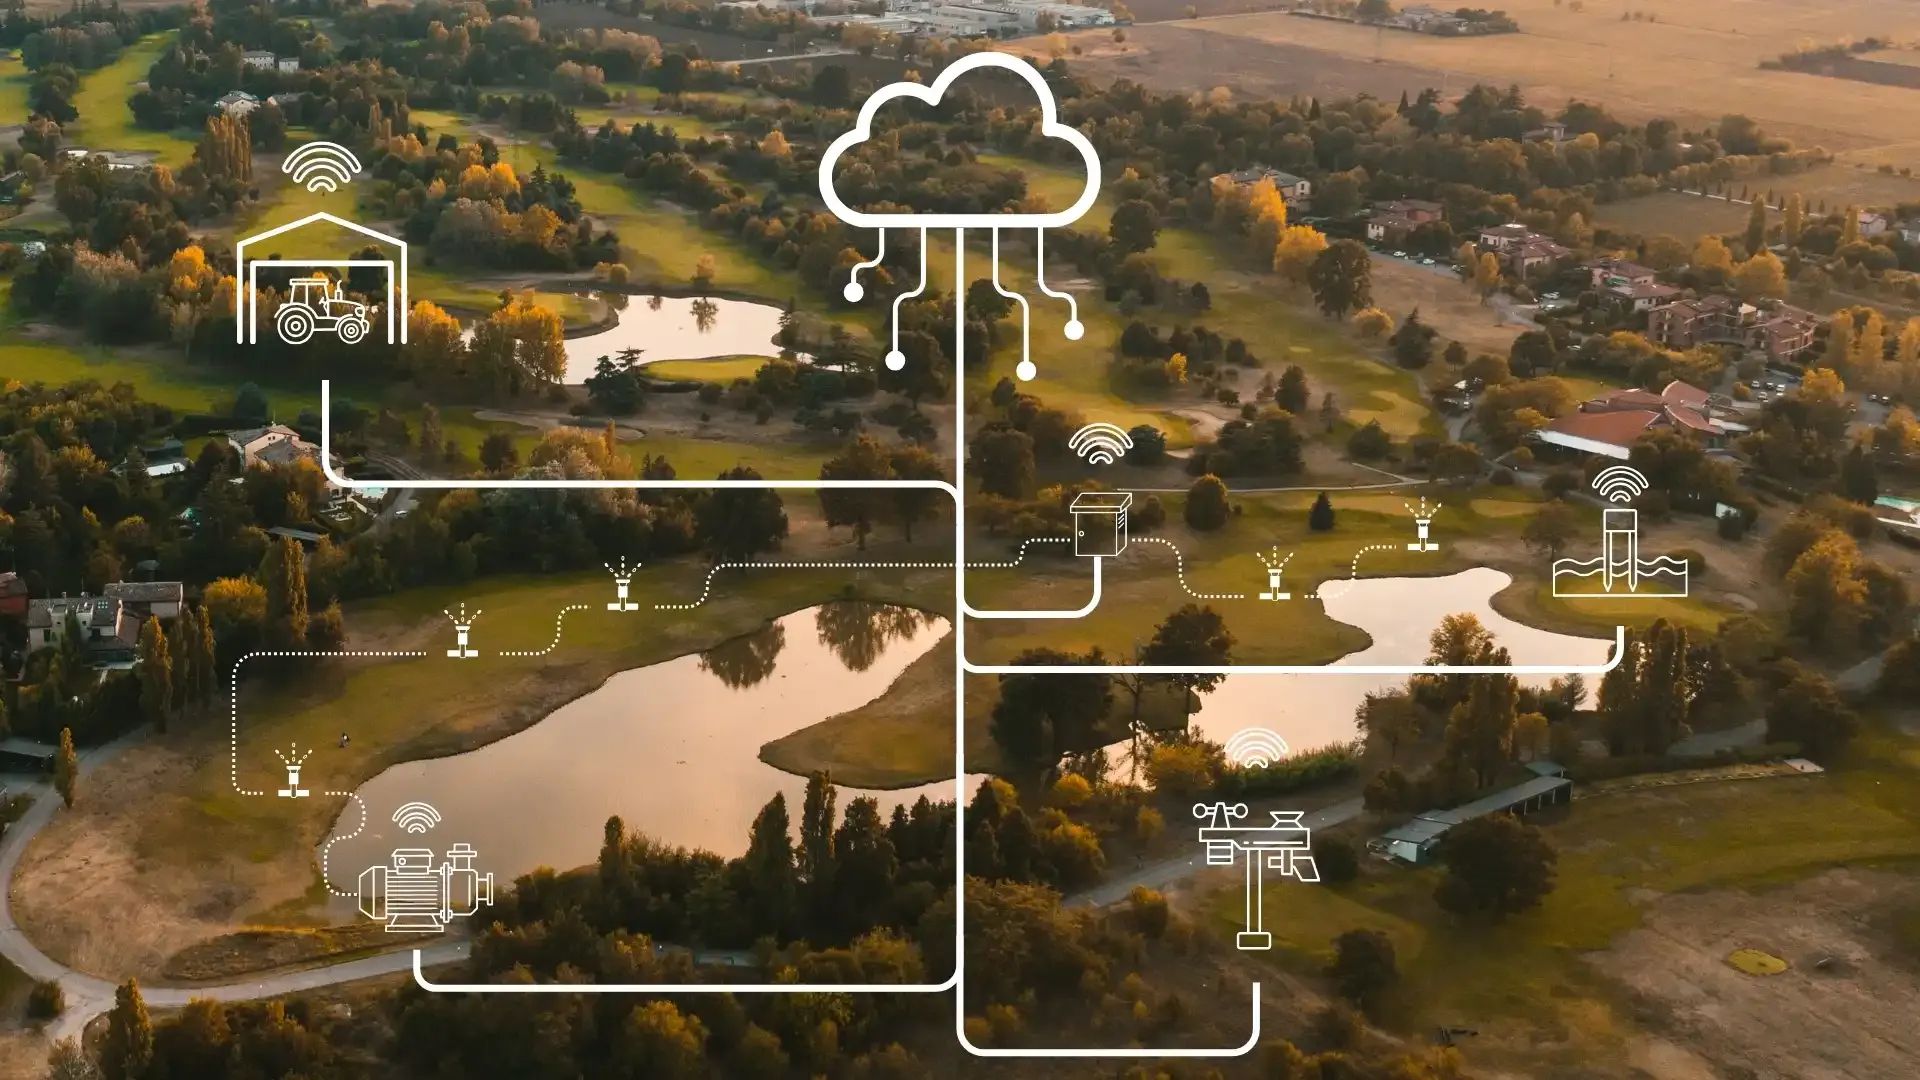
When the Machines Started Speaking the Same Language
Google released a protocol called A2A (Agent-to-Agent) alongside a reference implementation called the Agent Gateway.
What "Agentic" Means for Turf Management
Your weather data doesn't talk to your nutrition plan. Here's what separates dashboards from systems that actually think. And Why It Matters More Than Any Dashboard.